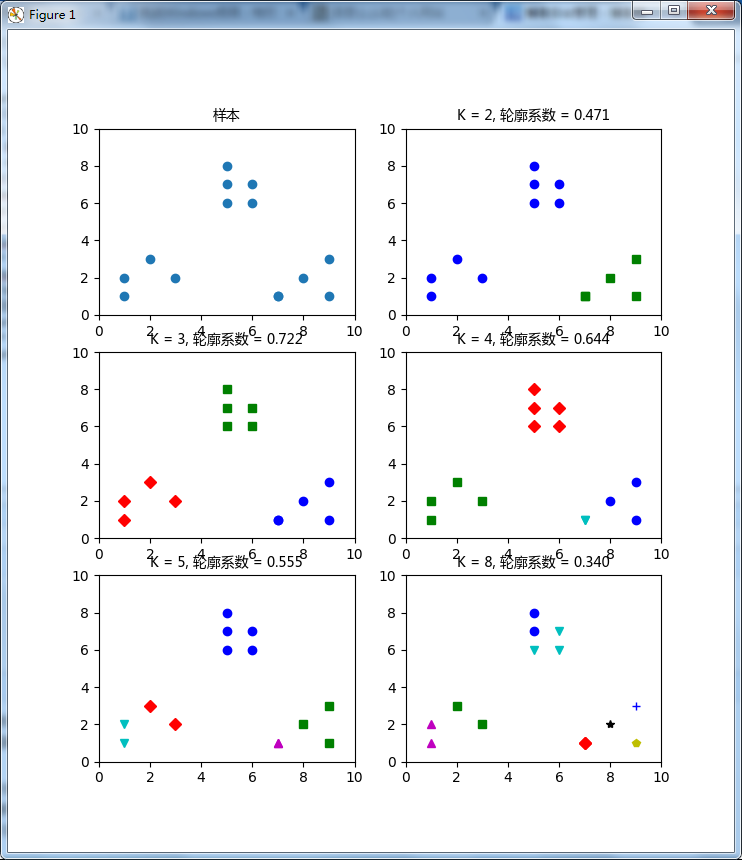
sklearn的kmeans测试
分类: MLTTyb 2017-03-07 607
#!/usr/bin/python3.4
# -*- coding: utf-8 -*-

import matplotlib.pyplot as plt
from matplotlib.font_manager import FontProperties
import numpy as np
from sklearn.cluster import KMeans
from sklearn import metrics


font = FontProperties(fname=r"c:/Windows/Fonts/msyh.ttf", size=10)
# figsize绘图的宽度和高度,也就是像素
plt.figure(figsize=(8, 10))
# 创建3行2列,p1为第一个的图形合集
plt.subplot(3, 2, 1)
x1 = np.array([1, 2, 3, 1, 5, 6, 5, 5, 6, 7, 8, 9, 7, 9])
x2 = np.array([1, 3, 2, 2, 8, 6, 7, 6, 7, 1, 2, 1, 1, 3])
X = np.array(list(zip(x1, x2))).reshape(len(x1), 2)
print(X)

# x,y轴的绘图范围
plt.xlim([0, 10])
plt.ylim([0, 10])
plt.title('样本', fontproperties=font)
plt.scatter(x1, x2)
# 点的颜色
colors = ['b', 'g', 'r', 'c', 'm', 'y', 'k', 'b']
# 点的形状
markers = ['o', 's', 'D', 'v', '^', 'p', '*', '+']
# 测试的k值
tests = [2, 3, 4, 5, 8]
subplot_counter = 1
for t in tests:
    subplot_counter += 1
    plt.subplot(3, 2, subplot_counter)
    kmeans_model = KMeans(n_clusters=t).fit(X)
    #     print kmeans_model.labels_:每个点对应的标签值
    for i, l in enumerate(kmeans_model.labels_):
        plt.plot(x1[i], x2[i], color=colors[l], marker=markers[l], ls='None')
        print(kmeans_model.labels_)
        plt.xlim([0, 10])
        plt.ylim([0, 10])
        plt.title(
            'K = %s, 轮廓系数 = %.03f' % (t, metrics.silhouette_score(X, kmeans_model.labels_, metric='euclidean')),
            fontproperties=font)
        # print(metrics.silhouette_score(X, kmeans_model.labels_))
    # 获取中心点的坐标
    counter_point = kmeans_model.cluster_centers_
    print("k=" + str(t) + "时的中心点为" + "\n" + str(counter_point))
    # print(counter_point)


plt.show()
plt.close()

本文地址:http://www.tybai.com/ml/sklearn%E7%9A%84kmeans%E6%B5%8B%E8%AF%95.html,来源于[TTyb],欢迎转载,转载请注明出处。
如果你觉得本站内容有帮助
我要请作者喝杯咖啡博客作者

微信公众号
爬虫代码不知道怎么写
关注公众号让作者帮你解决!
博客热点
-

在使用 `import org.apache.spark.ml.feature.VectorAssembler` 转换特征后,想要放入 `import org.apache.spark.mllib.classification.SVMWithSGD` 去训练的时候出现错误 阅读全文 » -

Python3 打包exe方式 阅读全文 » -

《漫威》系列电影中,距离《复仇者联盟4》上映一周,豆瓣分都是8.1分的钢铁侠》和《复仇者联盟3》,《钢铁侠》有353695人评价打分,《复仇者联盟3》有557491人评价打分,这两部电影是否一样好看? 阅读全文 » -
昨天收到公众号粉丝的爬虫需求:抓取平台:天猫或者淘宝;爬取对象:某个商品的各分类的价格和库存数 阅读全文 » -
在flask页面下载excel 阅读全文 » -
java.lang.NoSuchMethodError: org.apache.spark.sql.DataFrameNaFunctions.fill(JLscala/collection/Seq;)Lorg/apache/spark/sql/Dataset 阅读全文 » -
import org.apache.spark.ml.feature.{HashingTF, IDF}库中,TFIDF结果的字段含义 阅读全文 » -
spark读CSV为Dataframe和spark将Dataframe写入CSV 阅读全文 » -
将dataframe利用pyspark列合并为一行,类似于sql的GROUP_CONCAT函数。spark和pyspark的方式不能共用 阅读全文 » -
想看下最近房价是否能入手,抓取链家二手房、新房的信息,发现广州有些精装修88平米的3房2厅首付只要 29 万,平均 1.1万/平,果然钱不够信息来凑,总能发现便宜的房子! 阅读全文 » -

hive新建分区表 阅读全文 » -
hive删除表和表中的数据,以及按分区删除数据 阅读全文 » -

csdn目前设置每日使用5次后必须登录才能看到阅读更多的内容,异常恶心。因此搜罗了方法去解决这个问题 阅读全文 » -
pandas和spark的dataframe互转 阅读全文 » -
需要将代码转换为html使其显示好看一些,可以在这里进行装换 阅读全文 » -
需要调用命令行来执行某些命令,主要是用subprocess实时获取结果和捕获错误,发现subprocess的很多坑 阅读全文 » -
ubuntu的vim取消缩进 阅读全文 » -
需要实现两台机器的信息交互,使用 `socket` 进行调度 阅读全文 » -
centos7开放端口和防火墙设置 阅读全文 » -
python获取set-cookies 阅读全文 » -
记录在TensorFlow中使用GPU的一些操作 阅读全文 » -
pandas的apply操作类似于Scala的udf一样方便 阅读全文 » -
将dataframe利用pandas列合并为一行,类似于sql的GROUP_CONCAT函数 阅读全文 » -
python读取了一个list是字符串形式的[11.23,23.34],想转换成list类型 阅读全文 » -
python中使用了pandas的一些操作,特此记录下来。 阅读全文 » -
python中使用了numpy的一些操作,特此记录下来。 阅读全文 » -
Python3+Flask+uwsgi部署web服务,实现在新的IP下打开网址 阅读全文 » -
在python中,需要将整数均分成N等分。python divide integers N equal parts sum 阅读全文 » -
在Windows7下需要安装pyspark,写下教程步骤 阅读全文 » -
对于python数组的操作有点混乱,所以特此记录下来 阅读全文 » -
马尔科夫链转移矩阵计算方式 阅读全文 » -
需要将dataframe中的某一行变换为列 阅读全文 » -
scala获取某个时间间隔的时间 阅读全文 » -
Linux查看文件夹大小 阅读全文 » -
需要对dataframe按照某几列为key,对另外几列进行计算,考虑到scala的reduceByKey比groupByKey快速很多,所以使用了这个操作 阅读全文 » -
需要将Spark Dataframe转换为Scala Map集合 阅读全文 » -

Caused by: org.elasticsearch.hadoop.EsHadoopException: Could not write all entries [1/1] (Maybe ES was overloaded?). Error sample... 阅读全文 » -
spark调用distinct只能删除完全相同的行,而需要一种方法按照某几列作为唯一ID来删除重复,利用dropDuplicates可以完美解决这个问题 阅读全文 » -
spark调用elsticsearch的API对elasticsearch进行增删查改 阅读全文 » -

在 hadoop中,基于Linux命令可以给hdfs创建文件和文件夹,或者删除文件和文件夹 阅读全文 » -
spark调用hdfsAPI查询文件名字、删除文件 阅读全文 » -
hadoop使用出现安全模式错误Name node is in safe mode,退出安全模式 阅读全文 » -
在提取dataframe里面的列时,需要传入不定参数,即dataframe.select(args) 阅读全文 » -

github pages一直想添加代码高亮highlighter,基于jekyll 3.0的rouge终于搞定了 阅读全文 » -
System memory * must be at least *.Please increase heap size using the --driver--memory option or spark.driver.memory 阅读全文 » -

python万能库 阅读全文 » -
spark计算两个DataFrame的差集、交集、合集 阅读全文 » -
记录Linux查看的系统的命令,Linux查看系统、核数、CPU、位数 阅读全文 » -
任何一个电子商务公司想要存活下去,必须要时时掌控市场的动态,淘宝天猫上面的商品数据刚好能满足这样子的需求,所以写下这篇抓取教程 阅读全文 » -
特定环境下需要安装Linux suse 11 sp1,走过太多的坑,所以记录下安装的过程方便以后再使用 阅读全文 » -
在抓取网页的时候只想抓取主要的文本框,所以用了一个比较暴力的方法去识别 阅读全文 » -
在抓取网页的时候只想抓取主要的文本框,所以用了一个比较暴力的方法去识别 阅读全文 » -
python之BeautifulSoup使用 阅读全文 » -
selenium操控浏览器下拉到页面最底端 阅读全文 » -
一种去除dataframe中null、NaN和空字符串的方法,基于scala下 阅读全文 » -
chardet库是python的字符编码检测器,能够检测出各种编码的类型 阅读全文 » -
记录python读写2003和2007版本的excel的一些方式 阅读全文 » -
scala时间和时间戳互转 阅读全文 » -
在给代码带包成jar后,放到环境中运行出现No FileSystem for scheme file错误,找到解决办法 阅读全文 » -
在spark中给dataframe增加一列的方法一般使用withColumn,但是个人感觉少了很多功能,不如使用udf 阅读全文 » -
Scala查询dataFrame结构 阅读全文 » -
在使用数据库的时候,需要将查询出来的一列按照逗号合并成一行 阅读全文 » -
日志文件太多,需要清空 阅读全文 » -
安装了 `ubuntu-14` ,为了连接 `xshell` ,做出的一些配置 阅读全文 » -
在scala里面存在 调用Linux命令行的函数,得到返回的结果 阅读全文 » -
在scala中远程连接Linux,并发送相关命令到Linux上,得到返回的结果 阅读全文 » -
`spark` 中的 `reduce` 非常的好用,`reduce` 可以对 `dataframe` 中的元素进行计算、拼接等等 阅读全文 » -
很多人的个人博客用的是多说评论,但是最近多说突然说要关闭了... 阅读全文 » -
网上很多人问绑定域名要不要备案,很多人的回答是... 阅读全文 » -
从数据库提取出来的时间为 `String` 格式,现在需要转换为 `date` 并提取出里面的 *小时* 时间段 阅读全文 » -
为了加密 `.py` 文件,以前一般使用打包成exe ,但是最近发现可以将其编译成二进制文件pyc,虽然反编译难度不大,但是也需要一些水平 阅读全文 » -
python批量启动多线程 阅读全文 » -
Linux发现ctrl+c无法中断程序 阅读全文 » -
scala中spark运行内存不足 阅读全文 » -
scala打包jar并在Linux下运行 阅读全文 » -
scala的input 阅读全文 » -
scala的break和continue 阅读全文 » -
scala合并Array 阅读全文 » -
scala读取配置文件 阅读全文 » -
scala读取解析json文件 阅读全文 » -
scala判断数据类型 阅读全文 » -

IntelliJ的Scala配置 阅读全文 » -
scala的map操作 阅读全文 » -
python获取当前路径 阅读全文 » -
python的StringIO 阅读全文 » -
此方法相当于 `Linux` 系统下的`diff`,或者是 `git` 下的 `checkout` 阅读全文 » -
Linux查找文件内容 阅读全文 » -
python日志syslog运用 阅读全文 » -
python连接Linux命令行 阅读全文 » -
由于 `python` 频繁打印会导致IDE或者系统奔溃,因此将其打印信息写入日志文件中 阅读全文 » -
scala安装教程图文解说 阅读全文 » -
python获取当前运行程序的名字 阅读全文 » -
python获取文件夹名字 阅读全文 » -
python时间和时间戳互转 阅读全文 » -
python判断文件是否存在 阅读全文 » -
python创建递归文件夹 阅读全文 » -
sklearn的kmeans测试代码 阅读全文 » -
当使用库的时候,需要传递不确定个数的参数,那么写法是怎样的? 阅读全文 » -
python安装万能仓库的whl文件出错,原来是文件名弄错了 阅读全文 » -
安装sklearn库需要很多前提条件,而且不能pip3 install sklearn,因此写下教程 阅读全文 » -
Oracle查询得到的时间都是1970...,在python下将其转为时间戳 阅读全文 » -
过年很多人会发微信的红包,但是为毛很多人说自己得不到最佳,因此作者写了一个微信红包发送的算法 阅读全文 » -
在Linux下安装python3且不影响系统的python2 阅读全文 » -
hadoop完全分布式搭建 阅读全文 » -
最为广泛的两种分类模型是决策树模型(Decision Tree Model)和朴素贝叶斯模型(Naive Bayesian Model,NBM),本文讲解朴素贝叶斯 阅读全文 » -
数据挖掘中的ID3决策树算法,再次进行一个初步的学习 阅读全文 » -
虚拟机VMwareWorkstation下安装Linux系统centOS 阅读全文 » -

微信小程序在2017-01-09正式上线,本着跟上时代潮流的精神,写一份教程来看看 阅读全文 » -
埃拉托斯特尼筛法,简称埃氏筛或爱氏筛,是一种由希腊数学家埃拉托斯特尼所提出的一种简单检定素数的算法。要得到自然数n以内的全部素数,必须把不大于根号n的所有素数的倍数剔除,剩下的就是素数 阅读全文 » -
层次聚类是另一种主要的聚类方法,它具有一些十分必要的特性使得它成为广泛应用的聚类方法 阅读全文 » -
K近邻(KNN,k-NearestNeighbor)分类算法是数据挖掘分类技术中最简单的方法之一 阅读全文 » -
以前使用聚类是用spss,现在用python自己写了一次 阅读全文 » -
大数据时代开始流行推荐算法,所以作者写了一篇教程来介绍FP-tree推荐算法 阅读全文 » -
学习了一些chrome插件的基本用法 阅读全文 » -
大数据时代开始流行推荐算法,所以作者写了一篇教程来介绍apriori推荐算法 阅读全文 » -
海龟画图很好看,试着玩了一下 阅读全文 » -
做github静态博客,学习安装jekyll 阅读全文 » -
在破解Amazon的验证码的时候,利用机器学习得到验证码破解精度超过70%,主要是训练样本不够,如果在足够的样本下达到90%是非常有可能的。 阅读全文 » -
妹子要去招聘会工作,奈何网上仅仅提供招聘会的公司名字,没有提供招聘的职位,SO我写了个小代码给妹子在智联上面搜索职位,由于时间紧迫,前程的就不写了 阅读全文 » -
selenium设置浏览器属性 阅读全文 » -

javascript获取浏览器属性 阅读全文 » -
javascript操控浏览器 阅读全文 » -
为了获取网站js渲染后的html,需要利用selenium加载网站,但是会出现加载时间过长的现象,因此可以限制其加载时间以及强制关掉加载 阅读全文 » -

win10安装配置golang 阅读全文 » -
pycharm基本设置,省得每次都要去网上找 阅读全文 » -
百度指数抓取,再用图像识别得到指数 阅读全文 » -
selenium之xpath定位和input文本 阅读全文 » -
selenium在同一浏览器下多个窗口切换 阅读全文 » -
selenium识别下拉框 阅读全文 » -
假如外出工作,需要在另一台电脑上面pull自己的某个git远程项目到本地 阅读全文 » -
妹纸推荐书籍《御伽草纸》,网上找了很久都找不到下载,估计是被Amazon版权了,但是在网易云阅读看到有书,所以就写个代码下载下来。 阅读全文 » -
标签云是现在大数据里面最喜欢使用的一种展现方式,其中在python3下也能实现标签云的效果 阅读全文 » -
RGB颜色对照图 阅读全文 » -
python3的多线程很多人无法理解是怎么运行的,因此本文从程序猿的日常生活出发,写了一个由浅入深的多线程教程,这样子大家就不会觉得陌生了,多线程真的很简单很简单! 阅读全文 » -
selenium是处理异步加载的一种方法 阅读全文 » -
python数据库操作pymysql 阅读全文 » -
详解如何搞定瀑布流 阅读全文 » -
详解如何搞定瀑布流 阅读全文 » -

java从零到变身爬虫大神 阅读全文 » -
github上传本地项目 阅读全文 » -
没事玩了一下matlab 阅读全文 » -

mysql在大学学了,现在忘记得差不多了,复习复习一下 阅读全文 » -
css初学 阅读全文 » -
学习了一些html的基本用法 阅读全文 » -
学习了一些html的基本用法 阅读全文 » -
学习了一些html的基本用法 阅读全文 » -

EDM营销:全称Email Direct Marketing,即电子邮件营销 阅读全文 » -
老板要画雷达图,但是数据好多组怎么办?不能一个一个点excel去画吧,那么可以利用python进行批量制作 阅读全文 » -

markdown初学 阅读全文 » -

在上一篇算法中,逻辑回归作为一种二分类的分类器,一般的回归模型也是是判别模型,也就根据特征值来求结果概率。形式化表示为 p(y|x;θ),在参数 θ 确定的情况下,求解条件概率 p(y|x) 。 阅读全文 » -
在上一篇算法中,线性回归实际上是 连续型 的结果,即 y∈R ,而逻辑回归的 y 是离散型,只能取两个值 y∈{0,1},这可以用来处理一些分类的问题。 阅读全文 » -
今天我们这里要讲第一个有监督学习算法,他可以用于一个回归任务,这个算法叫做 线性回归 阅读全文 »
博客归档
博主梦想

博客日历
网站已运行
|
公元 年 月 农历年 年
|

感谢您的支持,我会继续努力的!

扫码打赏一下,你说多少就多少


打开微信扫一扫,即可进行扫码打赏哦